← Clinical Data Services
Clinical Data
Visualization
Solutions
Take your reports to the next level. Recognize patterns and identify outliers easily with our visualization technology.

Relationships & Patterns in Data
Clinical data visualizations enable you to see relationships and patterns in data — they supplement the tables and reports traditionally found in clinical trial management. Data visualization lets you track connections between operations and overall trial performance.
Aggregate Variables
This solution integrates with your clinical applications to collect trial data and other relevant information in one place, formatting it into graphics, charts, and dashboards that clarify data insights. Aggregate thousands of variables from disparate systems, no matter the source.

Data visualization track data relationships and patterns to aggregate data from an ongoing trial using analytics and graphs/charts/figures to:
- Identify poorly performing investigational sites
- Detect unusual patterns in patient- and site-level data
- Predict potential issues
- Mitigate areas of risk
- Correct problems in the execution of a clinical trial
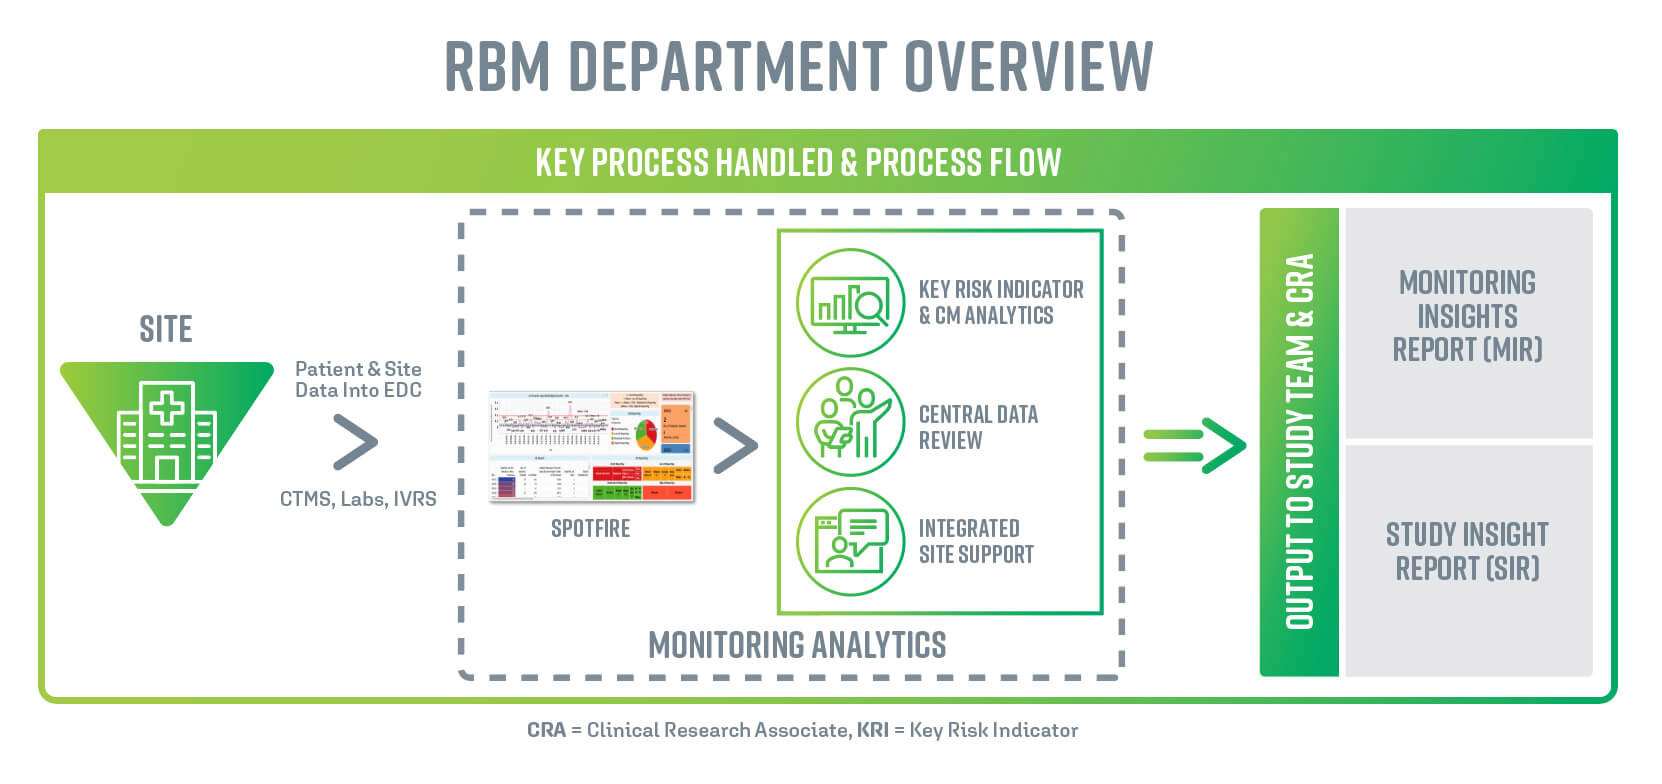
Veranex has developed a process flow to bring this information to our clients, as part of our risk based management service.

